Ultimate Tools to Track User Behavior on App
 by Shelly Parker
Running a business through the internet can be much harder than in-person in many ways. However, some may argue the biggest hurdle lies in understanding what your customer thinks, feels, and understands about your business. So, how can you track how your customer interacts with your app or website in order to understand their needs more?
Tools used to track user behavior on an app can be accessed by third-party software such as Google Analytics, Appsee, UserTesting, and Hotjar. The types of tools offered through these platforms include recordings, surveys, feedback, navigation paths, heatmaps, and A/B testing.
But what are these analytics and how can they help you? Here’s the breakdown to help you make your business the best it can be.

Third-Party Software
The easiest way to gain access to all the crunched numbers and statistics gathered about user interaction and behavior on your app is through third-party software. By using these software products, you can easily track user behaviour, navigation and the interactions of users within the app.
Google Analytics
This is the most commonly used analytics tool many of us are well acquainted with. Google Analytics helps track engagement, revenue, retention, new and returning users, demographics, and events. It also offers split testing and allows you to test different versions of web pages/screens and see how each fare. Google Analytics, and its partner Google Optimise, are free, but the paid version offers more benefits.

Appsee
Appsee is a platform that, in addition to its numerical data tracking, adds qualitative app analytics. This helps you to understand every action that your user takes. It can help to clear up confusions that the user might face and show what specific parts of your website are most interesting or helpful to users.
Mixpanel
Mixpanel helps with tracking and analysis for your mobile apps. It can show both data from the app as well as the desktop and mobile website versions. It is free to use and requires no code to access the statistics, tracking, and testing that they offer. Some of their tools and features are those that track engagement, retention, conversion, and insights.
UserTesting
UserTesting is a little different than the other analytics tools on this list. UserTesting recruits people to test your website and give you their feedback. This allows you to watch how real people would deal with and navigate your website for the first time.
Localytics
Localytics is another great quantitative analytical tool that helps track app usage and information gleaned various platforms. It helps you understand what different statistics could mean from your site or app and it actively supports iOS, Windows, Blackberry, Android, and HTML5.

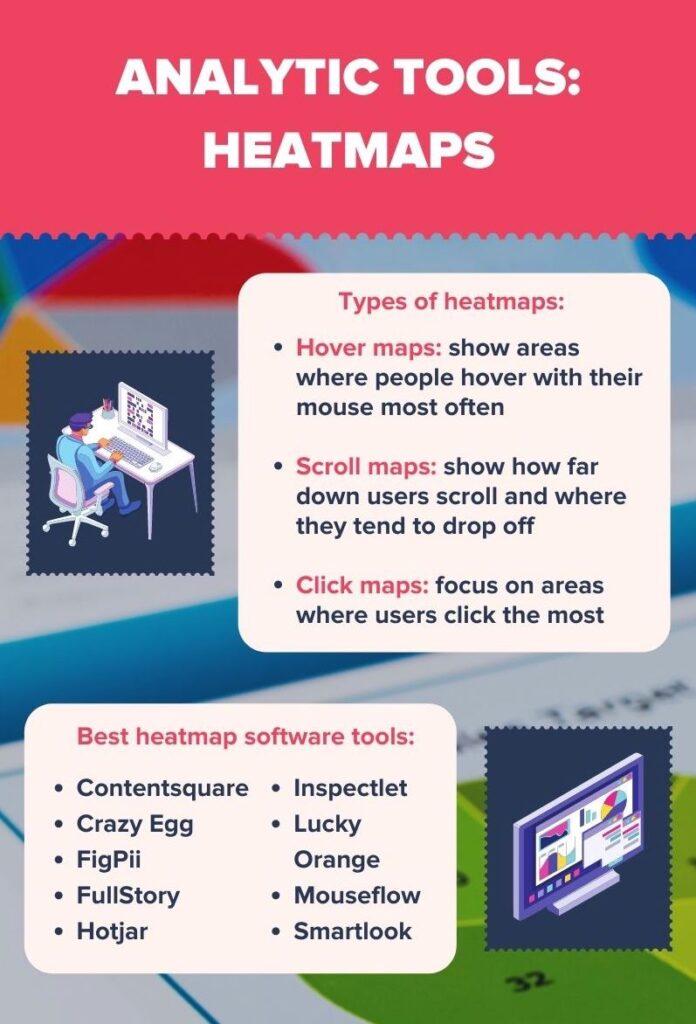
Hotjar
Hotjar is a subscription-based software that tracks user feedback and behavior analytics. It offers tracking tools that record aggregated visitor clicks, scrolls, and mouse movements, as well as browsing behavior and user feedback. The four base tools that Hotjar offers to accomplish this tracking are heatmaps, screen recordings, surveys, and feedback.
Amplitude
Amplitude is not for beginners in the analytics game. It is for in-depth analytics that can help map the customer’s journey. It has great technical tools so it is best for those already familiar with tracking systems in order for you to make the most out of its very specialized features.
It does come with a user price if you are wanting even more in-depth assistance in your projects. However, the prices for its Growth and Enterprise plans are not stated outright on any websites. However, it does have a very usable, specialized, and technical free plan that offers you an option to use this tool and its tracking features every month.
Userpilot
Userpilot is a no-code platform that makes it easy to create a personalized in-app experience that helps with many different user tracking tools. It allows you to state what you are specifically looking for in terms of user behavioral tracking and lets you see those statistics readily.
They can track behavior analytics and other tools together and show you the results of that data themselves so you do not have to go jumping between statistics to find your data. It lets you see what they are comparing and the conclusions that can be drawn from that data. This helps streamline the process for you.
User pilot is a fully subscription-based product that goes from $249 per month in their lowest tier up to $1,000 per month in their Enterprise tier which gives you many unlimited tools and permissions not found in their lower tiers.

Analytic Tools
These tools are some of the mechanics offered in the platforms above. They help fix many different problems users might encounter by pointing them out early and helping you understand how the public sees your website more fully.
Heatmaps
Heat maps are very helpful for seeing how users navigate your website or app. They show how users explore each menu and which ones they click on most.
The way they do this is by using a color spectrum much like an infrared sensor or elevation map. Areas with high activity, where users are clicking or resting their mouse more frequently. These movements are shown in a different color codes and helps in understanding the activity of an area that is interacted less often.
Many heatmaps can be filtered depending on what you really want to see. Say you want to know where users are getting stuck or not understanding where to go. In this case, you can filter your heatmap to show the areas in which the mouse stops moving and the user becomes unresponsive the most. This can quickly reveal a number of fixable problems such as a confusing design, or unintentionally hidden elements of your website.
You could also potentially check what it is that users click on first when visiting your app. This would be the most attention-grabbing piece on your app, so make sure it is the first piece of information that you want to present to the user.
This can also help to show which parts of your website are being completely ignored. Overall, heatmaps can potentially help improve your platform’s usability, which in turn makes visiting this app or website a more enjoyable experience, making the possibility of users returning more likely.
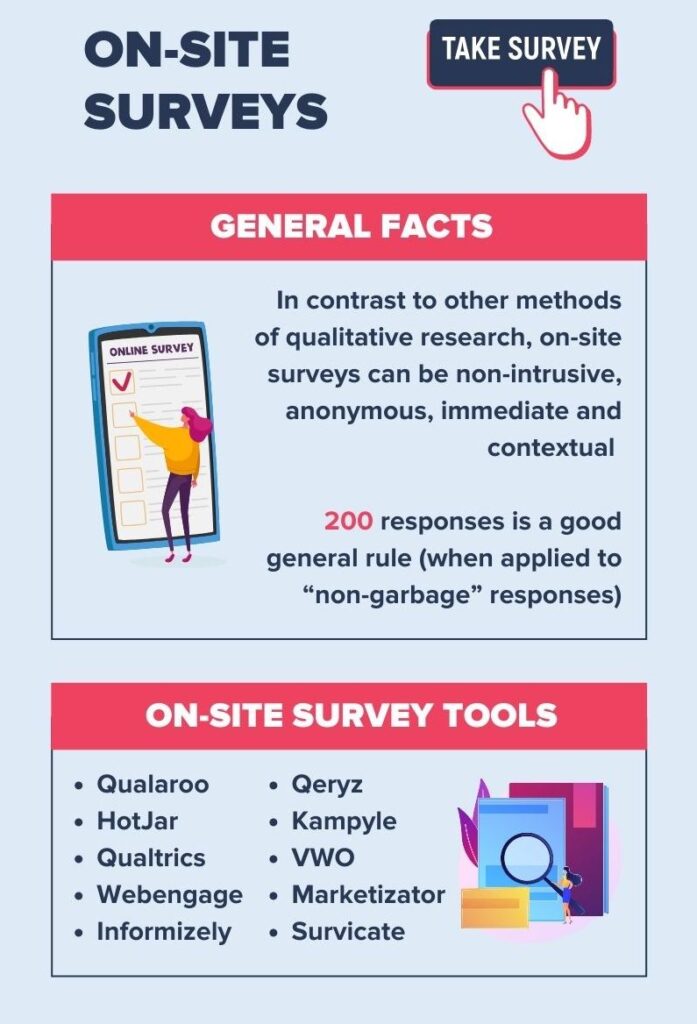
On-site Surveys
On-site surveys are a very upfront tool that allows you to measure how easy or difficult users find your website to navigate. These surveys can also ask users directly what they think the website will benefit from or what it needs in order to improve.
User surveys track user satisfaction, effort, and shows whether or not users would recommend your website or app to others. This can be very important for increased traffic on your website, so it would be in your best interest to listen to your users and their complaints, concerns, and praise.
On-site surveys are also one of the only ways you can communicate directly with the consumer. You can let your users know that you care about their feedback and that it really is useful to you. Adding personal connections to your website can help users feel heard and cared about, which can then increase the chance of them returning and trusting your app. Be sure to be careful about what questions you ask and consider all of the customer feedback you receive.
Feedback
Feedback is very similar to surveys in that it allows the users to give you their input when it comes to your website, be it that of advice for design, usability, or word choice. This tool is a great resource for gathering qualitative and quantitative data.
Qualitative metrics take loyalty, usability, and customer satisfaction to measure how customers feel about your website overall. It is important to get feedback in order to complete these measurements. Quantitative data can also be helped by the use of feedback. It measures how users interact with the website.
Feedback can help with this by asking about retention rates, abandonment rates, churn rates (the rate at which customers are leaving,) and task success.

Session Recordings
Session recordings are just as the name suggests. They are recordings of what users do or how they interact with your app or page. They can only show you what users did in a specific session, not all the time, but they can still be very useful for determining and identifying rage clicks vs. normal clicks.
Session recordings work best in tandem with other analytics such as product engagement and behavior flow reports. Engagement analytics can show you how many clicks happened per instance, but screen recording can help you see the ‘why’ behind these clicks. This is how you can see what your consumers are thinking or feeling during their session on your app.
This will also help you to see bugs or flaws in your system because you can tell when your users get confused or lost and quickly fix your problem by identifying these weak points.
Navigation Paths
Navigation paths show where users travel during their time with your product. It gives you a visualization of where the customer went first and then next. This helps you identify where the user’s eyes are drawn to first and from there you can make sure the most important or relative information is presented in the correct place for your users to see and understand more about your app or site.
This is a more simple version of session recordings that can show you a more specified version of user tracking. This can help you to find where users get confused. If the customer seems to be going back and forth between two pages, it is possible they are lost, and there should be a change in layout or formatting to make it more user-friendly or intuitive.
It can also show you what page users tend to abandon your app. Because it can track new and returning users, it can show where and when people leave and never return vs when people come back. This can help identify which page may be lacking in usability and turn customers away.

A/B Testing
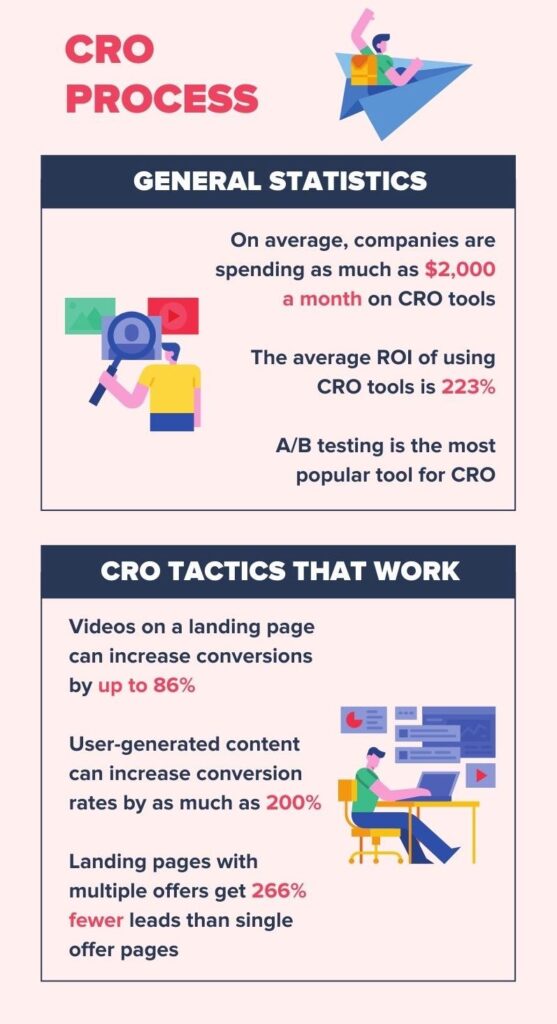
A/B testing is another fairly self-explanatory test system. It is when you compare two different versions of the same website or app in order to gather data. This can help you decide which version is better, and also help you see what features work the best with others or how your app might need to improve. This works best while used together with many of the other testing and user behavior tracking systems. When used in tandem, you can narrow down exact statistics about what it is users see, feel, and understand about your app or website.
The way this system works is by sending half of the users to site ‘A’ and the other half to site ‘B.’ This makes it easy to also beta test new features or changes to an already set-up site or app. It makes it possible to not fully implement changes before you know if they are successful.
A/B testing is different than the CRO process.

CRO Process
The CRO process is a plan to improve your conversion rate. It is when you analyze your whole website or app to find where problems or errors occur in the conversion process. It is there to help improve the activity on your website and use of your app or site through the use of identifying who brings people to your site, what stops them or makes them leave, and what hooks them to stay or become frequent users of your site.
When you understand what brings users to your product, you can make sure to play up that aspect and make sure it is being the most useful it can be to you and your conversion rate. You can also see what will drive people away from your site and can make sure you fix or change whatever that is. It can also help identify why users aren’t returning and/or help implement tools that will make sure users see the value in staying or ‘acting.’